Population project
May9
This week, we are learning about population. Today, we got a set of data, and we had to form a question and make a graph to represent it. My group’s question was: how do the populations of the countries in North American change from 1950, 1980, and 2010?
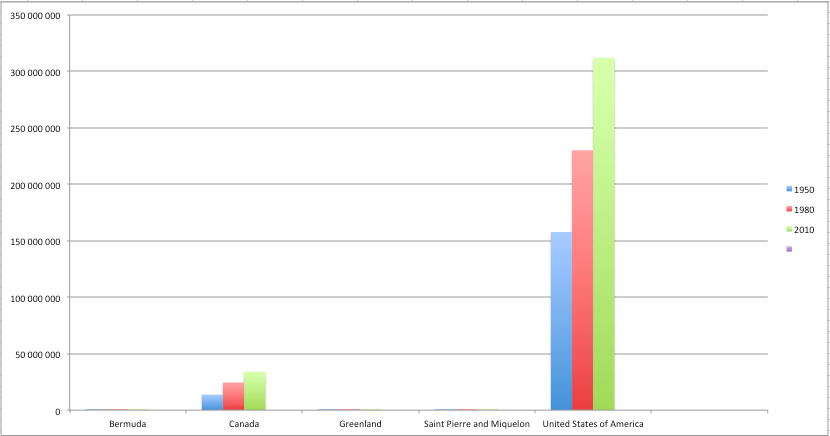
Some of the data doesn’t show up on the graph because the scale is too large.